What Are The Challenges Of A ‘Low-Carbon’ Renewable Energy Mix For Power Generation?
In our third instalment of insights, we concisely explain the challenges associated with a ‘low-carbon’ renewable energy mix and how some of these challenges could be addressed. This includes accounting of greenhouse gases to substantiate their goals in providing renewable energy, whilst minimizing emissions.
High density energy through the use of fossil resources and the consequential threat of greenhouse Gas (GHG) emissions to global warming, have paved the route for innovative ways to harness energy from nature, particularly the sea, wind and the sun. This has provided some hope that high polluting thermal generating sources using fossil fuels, can be replaced with cleaner renewable sources. However, there are still issues of how we can efficiently harness them due to variability in supply. Thus, the challenge shifts to ensuring a viable economic argument and a stable supply of electricity from the system assets that have been boosted by government subsidies. One metric that is used to assess this is the Levelised Cost of Electricity (LCOE) for the entire lifecycle of the technology. The other is the Energy Return on Energy Invest (EROI), which is the ratio of energy generated and delivered by that source, to the energy that is used from that source. Using such metrics helps to understand and compare the life cycle cost and economic sustainability of each generation source.
When assessing the technical challenges including the variation of renewable energy generating sources, in comparison to traditional power plants, the key points to consider are:
⦁ Variation/fluctuation in the availability and forecast predictions
⦁ Modular nature of construction
⦁ Location dependency due to choosing the best location to harness the energy
⦁ Conversion/inverters required to counter the non-synchronicity of the power generated and to stabilise/make it compatible for connection to the grid
⦁ Distance required for transmission to the transformers
The above points are reflected in the life cycle costs; specifically, they are apportioned into utilisation costs, balancing costs, connection cost or LCOE and grid costs. Utilisation costs reflect the true nature of the system and the factors that result in higher or lower lifecycle costs. What is more of a concern are the variabilities of the primary sources and the conversion of each source to electricity. This directly affects the utilisation costs and how the energy mix has to mitigate for any load deficit i.e. complementing the system with storage mediums, smart grid forecasting or more conventional methods such as the use of gas turbines to boost supply. Such complements contribute to the system costs. The greater the capacity contributed by renewable generating sources, the higher the utilisation costs. As such, the need to diversify renewable sources is paramount to a country’s generating mix. The proceeding section describes the various renewable energy sources.
Bioenergy
Bioenergy, specifically biomass, is used to describe energy from fuel derived directly from trees and plants. The fuel may be grown for the purpose of power generation or it may be waste such as straw from cereal farming, bagasse, rice hulls, maize husks or wood waste. The process is contentious in its definition as a renewable form of energy. This is based on the fact that the energy input into the process of growing, fertilising, harvesting the crops and processing them can require more energy than the output energy from power generation. Even more so are the emissions generated from burning the products particularly wood pellets and the fact that GHG emissions are released quicker than they are absorbed. The environmental impacts that relate to sustainability of land use and management makes classing them as renewables, very debatable. There are even questions relating to their use and the rise of global food prices. Nonetheless, the method continues to be part of energy policies in places like the EU. Global generation reached 555 TeraWatt hours (TWh) as at 2017 [1], with the LCOE at approximately $81.50/MWh [2]. The EU 28 nations were the largest generators in 2017 by approximately 194 TWh [1]. Quarter 4 of 2018 saw 6.7% of the UK’s energy supply come from biomass [3]. The total UK capacity as at 2017 was 6 GW [1]. Some of the UK’s biomass energy comes from existing coal fire plants, which have been converted to burn wood.
Solar Energy
Solar energy comprises photovoltaic (PV) and low temperature heat. PV presents the most common method for utilising the sun’s radiant energy and light. The energy and sunlight act on PV cells thereby producing electricity. In recent years, large-scale utility based PV farms have been constructed in the hundreds of MW capacity all over the world, with global capacity reaching 402 GW [1], and the LCOE at approximately $65.60/MWh [2]. In the UK, 1.7% of the energy generated in quarter 4 of 2018 came from solar PV [3]. China continues to lead the way in manufacturing of solar PV panels and total capacity utilisation (135GW as at 2017) [1]. The efficiency is greatly improved by installing rotary trackers in the modules. Integration issues include cloud cover, which can reduce output by as much as 60-80%. Another issue is module degradation of the cells by as much as 0.5%/year, with manufacturers providing guarantees for 20 to 25 years. The materials and manufacturing processes pose sustainability questions. The materials range from glass, coper and plastic to more exotic and toxic compounds such as cadmium telluride, copper indium gallium selenide, silicon tetrachloride and anti-freeze. The types of materials employed are dictated by the type of solar cells (silicon or thin film). Disposal and recycling of solar PV cells will pose some environmental challenges, which have not been fully addressed.
Concentrating solar power require the sunlight and uses tracker and mirrors/heliostats to follow the sunlight and reflect/concentrate it on absorbers. The available energy is used to heat up a working fluid. The working fluid can be oil, water or molten salt, which can be incorporated into a secondary circuit of a Rankine cycle to complement a conventional steam cycle power station. Global capacity for CSP reached 4.9 GW [1] with Spain accounting for majority of the capacity (2.3 GW as at 2017) [1]. CSP thermal energy storage global capacity was 12.8 GWh in 2017 [1]. Another use of CSP direct sunlight is for heating and cooling of homes and buildings using a refrigeration cycle.
Wind Energy
Wind energy capacity has increased considerably with total global capacity reaching 539 GW in 2017 [1]. China leads the way with approximately 188 GW of capacity as at 2017 [1]. LCOE is approximately $95/MWh for onshore and approximately $137.10/MWh for offshore [2]. Low utilisation and intermittency problems means backup systems are required to provide the residual load to meet demand. Wind turbines are only able to harness between 70-80% of the available kinetic energy due to environmental factors imposed on the turbine design as a result conservation of mass and momentum of the fluid stream (Betz’s law). The construction comprises a tall tower usually made of steel to mount the nacelle that houses the generator, and is coupled to rotors with 3 aerofoil-shaped blades. The entire assembly is housed within reinforced concrete foundations. Turbines require wind speeds of about 9-56mph although this range is not achievable in most areas but it is enough to harness a capacity factor of 20-25%. The UK’s capacity was approximately 20 GW as at 2017 [1] with a typical capacity factor of 30% (onshore) and 40% (offshore). Wind power contributed to 22% of the UK’s total electricity supplied in quarter 4 of 2018 [3]. However, a backup system as previously mentioned is required to support wind turbine systems. Maintenance of wind turbines is an issue in terms of cost because this involves removal of the entire tower, generator, rotor and blades. Furthermore, the operational life is typically 30 years meaning that vast amount of turbines in Europe will need to be replaced in the next decade. The unknown decommissioning costs present a big problem in terms of estimating the LCOE. This means that significant margins are added to the overall price/MWh.
Hydropower
Known as one of the oldest and most reliable renewable resources, electricity from hydropower (when flow conditions allow) can be an efficient renewable way of producing electricity. Considerable amount of mechanical power can be generated with stable inertia, which means that generation can be synchronous and not require backup like wind and solar. Global hydropower capacity reached 1.1 TW (China has the largest capacity share of 310 GW) [1], with the LCOE at approximately $59.60/MWh [2]. Hydropower is ideal for peak load backup for solar and wind. A big fraction of the world’s renewable electricity generation comes from hydropower. The primary advantage of hydropower is its ability to deliver high peak loads at any point in the season. This is because of the relative short time it takes to start the turbines. However, this ability is dependent on the type of hydro system. High irrigation requirements will limit the flow that is diverted for power generation; in other instances, run-of-river hydropower plants may have reduced seasonal flow. Hydropower contributed to 1.7% of the total UK’s electricity supplied in quarter 4 of 2018 [3].
Geothermal Energy
Geothermal energy is the heat that is sourced from the body of the earth. It is location specific and is based on hot steam, which can be brought from deep below the ground and used to drive a steam turbine. Specifically, the earth’s crust is the region of focus and is approximately between 5 to 55 km (3-34 miles) thick, with the temperature increasing by an average of 17 to 30°C for each km below the surface. Geothermal energy has relatively low running cost and is always available. Key locations for geothermal energy include Turkey, Iceland, New Zealand, Indonesia, Italy and the USA. The total global geothermal capacity for both electricity and heat reached 170 TWh in 2017 (US leads the way with 2.5 GW) [1]. Typically, the
http://injuryandtreatmentcenter.com/zoloft-generic/
areas with potential for geothermal energy range between 150°C for hot dry rock geothermal to 400°C, at depths of 4-5 km. Figure 1 is a picture of a geothermal plant next to an area of hot springs in Iceland.
Fig 1 – Geothermal plant next to Hot Springs in Iceland
Ocean Energy
Ocean energy can be covered in 3 different technologies, which are all designed to harness energy from seas and oceans. Specifically, these are ocean currents also known as ocean or tidal stream, wave energy and ocean thermal energy conversion (OTEC). These forms of energy are all in early demonstration phases and have shown promises of potential full-scale commercial deployment. Ocean current or tidal streams require the tides to be harnessed with barrages in a bay or estuary. Turbines are placed in close proximity to the barrages and are turned when trapped water is released in either direction. Whilst this has been achieved in Canada, France, Russia and South Korea, the technology is constrained environmentally, which restricts worldwide deployment and has also led to the Swansea Bay Tidal Lagoon project being shelved in 2018. Nonetheless, there are still other forms of tidal energy being explored such as tidal arrays. The technology as a renewable source of energy is constant hence the potential for predictability due to the currents generated. Estimation of global energy dissipation due to tidal is approximately 22,000 TWh with 200 TWh considered economically recoverable and approximately 0.6 TWh converted into electricity. Wave energy technology harnesses the energy from the surface waves around coastal and near shore sites. Portugal has the first commercial plant (Agucadoura Wave Farm), which benefits from fluid being pumped at high pressure through turbines. The farm is capable of producing over 2.3 MWe. In the UK, it is estimated that wave, combined with tidal has the potential to deliver approximately 20% of the UK’s current energy demand. However, the technological risks such as survivability of the equipment, the uncertainty in recoverable energy and wind power having more coverage at the expense of ocean technologies, have limited further R&D investments in projects such as the Pelamis sea snake and the Oyster hinge-flap. OTEC depends on the principle of using heat source and cold source to drive an engine. The heat source is at the surface of a tropical or subtropical sea, whist the cold source is in the depths of the sea. With typical surface temperatures of 24°C to 33°C and temperatures of 5 to 9°C at depths of 500m, this provides an exploitable temperature difference of up to 28°C. However, losses in the process means that it is likely to be approximately 20°C, allowing for a conversion efficiency of 3-4% when pumping of the cold water is considered. The typical depth of 500m would need to be increased if there is risk of the cold fluid becoming warm. The challenges associated with the temperature variation and the effect of the variation on the geometry of the pipes particularly the cold water pipe, including choice of cycles means that only a handful of projects are currently in development.
Accounting for Green House Gas Emissions
Electricity generating systems contribute two thirds of global GHG emissions. However, quantification of their total GHG emissions can be a challenge due to differences in adopted methodologies, assumptions, and input figures relating to processes. Furthermore, of the GHGs, only carbon dioxide (CO2), methane (CH4), and nitrous oxide (N2O) are considered using a carbon equivalent (CO2eq) unit of measurement. A review of accounting methodologies [4] indicated that the Life Cycle Assessment (LCA) method is most widely used. Figure 2 shows the accounting scope taken from [4]; Figure 3 illustrates the LCA method [4].
Fig 2 – Electricity Generating Systems and Accounting Scope [4]
Fig 3 – LCA method for Electricity Generation [4]
Table 1 which is based on research by the Intergovernmental Panel on Climate Change [5,6] shows the life cycle CO2eq of typical generating technologies (current commercial and pre-commercial technologies), in order of the highest median value.
Table 1 – Emissions of Commercial and Pre-Commercial Electricity Generating Technologies [5,6]
Challenges for Renewable Energy in the UK
With reference to Table 1, the data suggests that out of the commercially deployed renewable technologies, wind contributes the least amount of GHG emissions (CO2eq/kWh), with biomass (dedicated) contributing the most amount of emissions. Biomass with coal is not considered due to the combined fossil fuel usage. An observation from the figures indicate that they do not take into account the intermittencies in operation for technologies like wind power. Due to grid priority provided for wind and solar as a result of their low capacity factors (weather relating), backup load-following systems are required to provide peak power in order to maintain steady output. Such backup sources are usually provided by base load sources such as nuclear or hydropower, which are dependable. The effect on other sources within the energy mix includes increases in CO2eq/kWh due to rapid increases and subsequent decreases in power. This effect is not accounted for in the system and emission costs due to the fact that wind and solar costs are isolated from such effects.
With regard to bioenergy/biomass, it is labelled as a carbon neutral form of energy generation based on the fact that it involves the burning of natural products. However, the GHGs are the same as products released from burning of fossil fuel. Such products include sulphuric oxides and nitrous oxides as well as carbon monoxide and carbon dioxides. Forestry incineration is particularly controversial due to the fact that the released carbon dioxide gases have been accumulated over long periods and are not necessarily reabsorbed quickly by trees and plants.
Significant variations between min and max CO2eq/kWh is indication of the level of technological complexities. It is also evidence of insufficient learning from experience (LfE) due to geographical and environmental constraints, disjointed and inflexible regulations or technological maturity. This is particularly the case with hydropower, of which all of the aforementioned reasons could apply.
Predicting future energy mixes with huge emphasis being placed on renewables is challenging. This is due to the electrification of vehicles and potential electrification of heating pumps to replace gas used for heating of homes and buildings. The demand for electricity will continue to rise. However, wind and solar which are weather dependent, provide the majority of the renewable capacity in the UK. With reference to the UK, it does not have a variety of renewable generating sources with large enough capacities (i.e. hydropower). The UK has a hydropower potential of 850MW to 1550MW. However, environmental concerns have limited their progress into large scalable sources [7]. Instead, the focus is on micro hydro systems in local communities. Concerns raised with tidal streams technologies have also hampered development of the technology.
Renewable energy sources have different non-aligning sets of environmental costs, when compared to fossil generating sources or nuclear. In addition, they take up a lot of area due to their low energy footprint. Further to this, is the noise pollution and poor landscape from technologies like wind. It is inevitable that more capacity from wind and solar will be added to increase their contribution to the UK’s energy mix but renewable solutions with reduced intermittency should be explored or its capacity increased in the case of hydropower in order to improve grid resilience in meeting future power demand.
Areas for future work to support Renewable Energy Development in the UK
⦁ Methodologies which account for GHG needs to consider carbon intensity analysis that varies with time. This allows the fuel mix to be optimised to maintain minimum emission from electricity generation. It would also help in planning future grid expansions by maintaining a low-carbon grid.
⦁ An appropriate and environmentally-friendly method of disposal and recycling of solar panels at end of life requires careful thought in terms of the impact on the environment. A robust plan based on R&D needs to be defined to avoid toxic materials contaminating the environment.
⦁ Research needs to be conducted to provide a full emissions picture and effect of other GHG emissions on the environment in addition to CO2, CH4, and N2O. Furthermore, a true emissions cycle including a timeline which accurately estimates when CO2 is absorbed by trees and plants, needs to be developed for biomass to improve the understanding of the carbon intensity and to provide better estimates of the CO2eq/kWh.
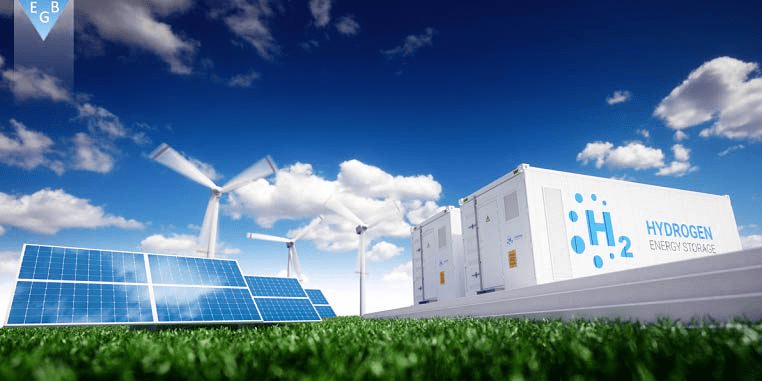
⦁ Development of the hydrogen economy needs to be accelerated including an understanding of the total CO2eq/kWh and the LCOE/LCOH (Levelised Cost of Heating equivalent).
⦁ Development of full-scale storage mediums such as hydro-pump and battery storage systems needs to be accelerated including an understanding of the total CO2eq/kWh and the LCOE.
⦁ Small scale geothermal projects need to be commissioned in areas that have been identified as having potential resources [8].
⦁ Investigate how leading countries have successfully and sustainably harnessed hydropower to understand if the environmental risks in the UK can be mitigated by improved infrastructure designs.
⦁ Ocean projects, particularly tidal stream projects, need to be reignited and further developed based on knowledge gather from recent UK projects and other parts of the world.
⦁ Transitioning to smart grids, which will modernise the transmission and distribution systems to maintain a reliable and secure electricity infrastructure, capable of meeting future demand.
References
- REN21 (2018), Renewables 2018 Global Status Report. Website: http://www.ren21.net/wp-content/uploads/2018/06/17-8652_GSR2018_FullReport_web_final_.pdf, Last accessed 15th April 2019.
- Gad-Briggs, A., (2017), TERA of Gas Turbine High Temperature Reactor for Next Generation Nuclear Power Plants, PhD Thesis, Cranfield University & EGB Engineering, Cranfield, UK.
- Biomass UK Renewable Energy association, Website ⦁ https://www.biomass-uk.org, Last accessed 15th April 2019.
- Khan, I., (2019) Greenhouse gas emission accounting approaches in electricity generation systems: A review, Elsevier Journal of Atmospheric Environment, vol 200, pg 131-141.
- IPCC (2014) ⦁ IPCC Working Group III – Mitigation of Climate Change, Annex III: Technology – specific cost and performance parameters, IPCC. p. 7.
- IPCC (2014) IPCC Working Group III – Mitigation of Climate Change, Annex II Metrics and Methodology – Table A.III.2 (Emissions of selected electricity supply technologies (gCO 2eq/kWh)), IPCC, pp. 14–31.
- UK Government (2013), Harnessing hydroelectric power, website: https://www.gov.uk/guidance/harnessing-hydroelectric-power, Last accessed 15th April 2019.
- British Geological Survey, Geothermal energy – what is it?, website: https://www.bgs.ac.uk/research/energy/geothermal/, Last accessed 15th April 2019.